

Travis McPhail introduces the new Google funded exhibit at the National African-American Museum, which made it’s debut at a reception Feb. 1, 2018, in Washington, DC.
“Maps are so much more than images. With Google Earth, we built a 3D model of the world,” said Googler and Rice University alumnus Travis McPhail. He should know; McPhail (Ph.D. CS ’10) specializes in two- and three-dimensional renderings and imagery for Google products like Maps and Earth.
“If it were just an image, you couldn’t zoom in and out; it would become very pixelated. Working on any of these applications requires both asset management and graphics knowledge. Take Google Earth – you’ll see mountain ranges, valleys, bridges, 3D cities, the complete gambit.
“We had to think about what a person would see when looking at a specific place in the world. How do we transition a building’s 2D footprint to a 3D model when the user zooms in? For Street View, the easy part is the Google car driving down the street with the funky looking camera on top. The hard part is fitting that data to a human’s perspective. Not only do we have to manage all those images taken along millions of miles of roads, we have to map the transition from point to point as the person’s perspective changes.”
McPhail was completing his undergraduate degree in computer science at Rice when he realized he was not ready to work in the technology industry. “I wanted to develop my research muscles and push the boundaries of CS a bit further,” he said. “I considered other grad programs briefly, but Rice was close to home and my decision was heavily influenced by family ties.”
His first big research project with his graduate adviser, CS professor Joe Warren, was published for the 2006 international computer graphics and interactive technologies conference, ACM SIGGRAPH. McPhail, Warren, and a colleague at Texas A&M University were working on a technique to inform 3D deformations. Deformation is the process by which an object –like a malleable gingerbread man– is stretched, twisted, rippled, or otherwise ‘deformed.’
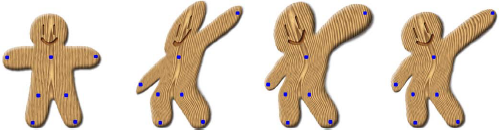
Scott Schaefer, Travis McPhail, Joe Warren. July 2006. Image Deformation Using Least Moving Squares. Retrieved April 2, 2018 from https://dl.acm.org/citation.cfm?id=1141920
“If you think about how Hollywood animates 3D characters,” McPhail said, “you can imagine 3D models being controlled by deformation functions defined by enclosing volumes (grids, cages, skeletal systems, etc.) Deformation functions from researchers like myself have a wide range of applications, from 3D CT scans to forming 3D character models for Hollywood. But I actually got my start in industrial 3D applications in Houston, in oil and gas.”
He was working on 3D modeling of data collected by sending seismic waves into the Earth’s subsurface. Each moment-in-time picture reveals layers and pockets that lie deep below the surface. The data must be viewed from multiple angles in order to identify where oil and gas reserves are most dense, and McPhail was one of the engineers who could create 3D models from flat image data.
His work inspired ideas for a startup, but he wanted to do local market research before diving further into the concept. “During the week, I’d be an O&G researcher. On weekends, I wanted to do informal market research, which required observing how customers interacted with visual data. Working in an Apple store seemed like the perfect opportunity to make observations while working with customers.
“But the local Apple store turned down my application. Instead I got a call from Apple in Cupertino. They said, ‘We like your graphics background.’ They were going to break away from Google and do their own mapping project, so I headed to California. Then Google called me a few days later; I really wanted to help push out the new mapping renderer, so I accepted their offer.”
McPhail’s computer graphics experience helped prepare him for the task of creating mapping tools for mobile devices. He said rendering the mapping app itself is graphics intensive: “Maps, Google Earth, and Street View, are all graphics-heavy applications.”
The products were intended to be helpful to individual users, but creating a 3D model of the world turned out to be a highly political endeavor. “In a given month,” McPhail said, “almost two billion people look at our products. If something is inaccurate, someone will definitely notice. Before we incorporated a stringent process for checking the input from our users, people tried to add some very interesting things to our maps.
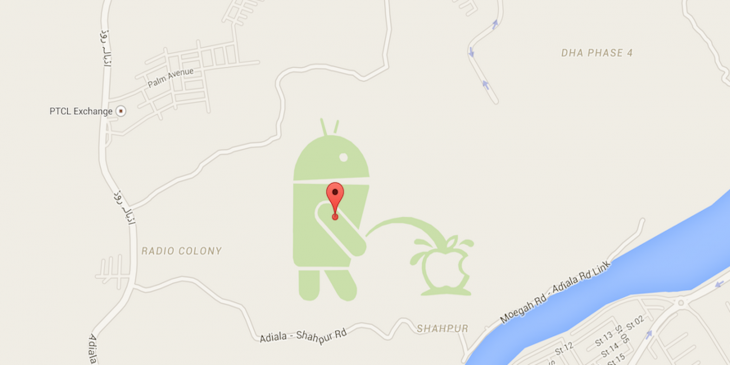
“A good day is when I get to see people have magic moments with our products. Some of those moments I’m recalling go back to 2016, when we started really incorporating real-time events with our maps. Like showcasing the Pride Parades or Women’s Marches around the world on the actual dates of the events. The real time exposure and more dynamic maps helped people understand why we were re-routing them.
“The amount of appreciation from people was great, and it revealed their pride in local events. After we added that fresh content, events like the Rio Marathon, Boston Marathon and Carnival had a more personal touch. That effort on our part led to a lot of magic moments for people.”
McPhail has enjoyed some of his own magic moments in a career story that could have been written by one of his colleagues in Hollywood. In a recent project, he led a team of Googlers in the creation of an interactive 3D exhibit wall for the National Museum of African American History and Culture.
Travis McPhail completed his B.S. in Computer Science in 2004, his M.S. in 2007, and his Ph.D. in 2011. His graduate program advisor was Joe Warren.